Azure is an amazing platform that can offer your company streamlined productivity and versatility. However, it can also be extremely complicated. With organizations easily owning hundreds of Azure related products that they need to pay for every month, it can be a challenge to understand where all your organization’s Azure spend is coming from.
If you try to break down your cost using the invoices found in your Azure portal, you will find a nightmare of complicated data spreadsheets waiting for you – which is where MetrixData 360’s Azure Usage Tool comes in! Our Azure Reporting tool is custom-tailored to decipher Azure’s complex pricing and break it down into easy to understand and utilize information.

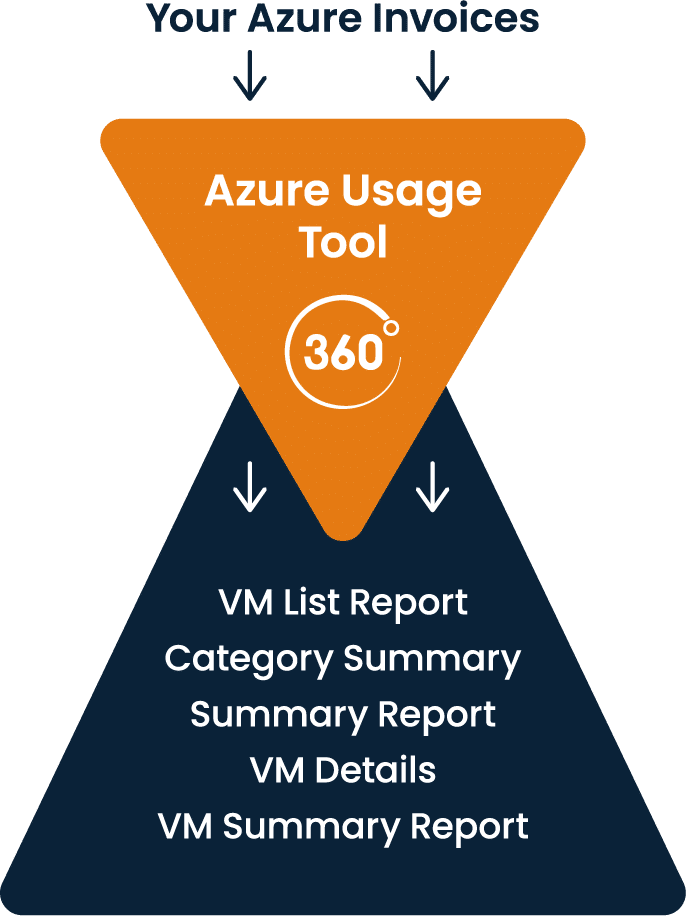
After retrieving the relevant usage data from the Azure portal (you can see Microsoft’s instructions here on how to retrieve your daily usage reports, your portal may be constructed differently depending on if you have an EA or not), and allowing your MetrixData 360 licensing specialist to upload those reports onto the Azure Usage Tool, you will receive five interactive reports in return.
This report breaks down your current Azure costs by category such as VM, SQL Database, Storage etc. It then provides your total cost in each category, along with the list price and any discounts that have been applied.
This summary has proven exceptionally useful, as one client recently discovered. Despite having it written in their contracts that they had been given a 10% discount on every Azure product they owned, this discount hadn’t been applied and they were currently paying for their products at list price. Through this single discovery, they were able to correct this error and save their company over $22,000 on their Azure monthly spend!
A step beyond the Category Summary, the Summary Report looks at every category covered in the Category Summary in detail, examining subcategories by product, name, zone, or region. This allows you to easily examine in-depth the cost-effectiveness of each product. An example of this report’s usage can be found in its ability to cross-reference rate cards and price lists to calculate which region is the cheapest for product deployment, similar to websites where you can search for the cheapest plane tickets between airlines.
Virtual Machines (VM) are particularly tricky to keep track of within an organization, which is why our next three reports deal with organizing VMs exclusively. The VM Summary Report arranges all your VMs by type and includes how many VMs have been created of each type, the number of processors, the memory capacity each VM has, and whether the VM in question is Windows or Linux. The report then takes this information and calculates the cost of each VM, the rate, the list price, any discounts that have been applied, and whether Azure Hybrid Benefits have been activated.
The VM list report examines each VM instance, providing elements including the pricing, what you’re actually paying for, if there are any Azure Hybrid Opportunities, and examining which region is the cheapest for deployment.
This final element to our VM examination focuses more in-depth on items covered in the VM List report such as the disks and daily usage of all the VMs running in any specific data center. The VM Details are also usefully interactive, allowing you to drill into the tiniest details surrounding the costs of each VM. The VM Details also tie in any non-VM elements that are connected to the VM’s overall cost such as storage and bandwidth, allowing you to find the root cause of unknown cost spikes related to your virtual machines.
At MetrixData 360, we understand how business essential and sensitive the data that our tool deals with can be, and we take the security of your data very seriously. This is why our tool does not have to be uploaded into your software environment; you do not have to worry about our tool disrupting your delicate software infrastructure or interacting with data it shouldn’t have access to. We work only with the data you provide us, and we maintain strict Non-Disclosure Agreements with our clients.
Our tool has the single goal of finding you cost saving potentials. Our licensing experts can help you scrutinize your data to pull out all unnecessary spend so that it can be invested back into your organization. One popular solution MetrixData 360 experts use our Azure Usage tool for is to harness Azure Hybrid Benefits. Bringing your own licenses to Azure or having a combination of licensed products both on and off the Cloud can prove to be extremely cost-effective if properly configured. The Azure Usage tool helps coordinate your efforts, allowing you to pinpoint instances where Azure Hybrid would be effective in saving you money.
The reports that are produced by Azure portal are extremely difficult to work with. Customers of Azure usually can’t make sense of the sheer amount of data that they’ve been given. Our tool automates and simplifies the process of analysing this data. We compile it into easy to read graphs and charts so you can make better use of your Azure Portal invoices.
©2022 MetrixData 360. All rights reserved.